Thursday 29 December 2016

Website Audit
In website governance, a content audit is the process of evaluating content elements and information assets on some part or all of a website.
This 3 Step Website Audit Guide will help you do a full audit of all of your website pages. The audit can take several hours, but it’s well worth it to take the time and identify ways you can improve your website. Like great food, don’t try to rush the process.
Goal: Identify and improve website pages to generate qualified visitors, leads and customers.
Step 1: Identify Most Visited Website Pages
Go to the Analyze tab in HubSpot and click on Visits by Page. Change the date range to one year. At the bottom of the app there is an export to Excel” Button. Click on that button and to export the data to excel. Start with your 10 most visited pages and copy those page titles into the Website Audit Worksheet.
Step 2: Grade Each Website Page
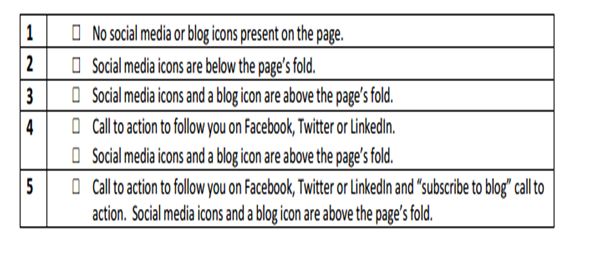
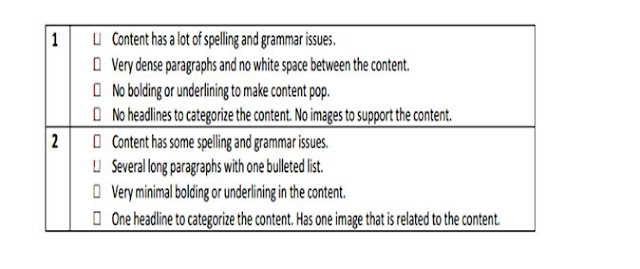
You need to identify what pages require the most work, so you can start improving them. You will grade each website page using five categories: page content, design/eye-path, lead generation, search engine optimization, and social media.
You will grade the page on the five categories, giving each category a grade of 1 through 5, for a total of 25 possible points. Use the following criteria to determine the page’s grade for each category. Use the Website Audit Worksheet to track your page’s grade and take notes in the worksheet as you grade each page.
Page content
Design/eye-path:


Lead generation

Search engine optimization


Social media

Step 3: Improve Your Pages
Start improving the pages that got the worst grade. Remember to think about the goals of each page and use those goals to help you improve the page.
For example, if you want someone to request a trial on one of your product pages, then make sure trial call to action is above the fold, compelling and explains the value of the trial.
How to Use Six Google Analytics Reports to Complete a Website Content Audit
The six reports include the following:
1. Channels report
2. Landing Page report
3. New Vs Returning Visitor report
4. Frequency & Recency report
5. Site Search report
6. Behaviour Flow report

     Finding Actionable Insights
Today’s business leaders want more than a forensic analysis of what happened in the past. They want to know what will happen in the future, why it will happen, how they can prevent problems, and how they can leverage the insights contained in their data to their competitive advantage. This need for insight inspires and motivates major investments in tools and architecture that can help executives harness the power of big data. Advanced analytics and the ability to analyze all data in an organization’s systems can transform a business—but the process must be efficient, timely and accurate in order to be effective.
Involving the Entire organization:
Enterprises are increasingly looking to find actionable insights into their data. Many big data projects originate from the need to answer specific business questions. With the right big data analytics platforms in place, an enterprise can boost sales, increase efficiency, and improve operations, customer service and risk management
Notably, the business area getting the most attention relates to increasing efficiency and optimizing operations. Specifically, 62 percent of respondents said that they use big data analytics to improve speed and reduce complexity.

Resources to Master Google Analytics
Since you may be a novice or expert user, we’re going to provide both beginner and advanced user resources that everyone can take advantage of.
Beginner Resources
1.      The Absolute Beginner’s Guide: A great resource by MOZ, you’ll learn a little of everything in this post. From installation to filtering reports, this guide will teach you how to use analytics quickly and easily.

2.   A Beginner’s Guide to Google Analytics: Vertical Response published a great post that teaches you how to use analytics within just minutes.

3.   How to Use Google Analytics on Your WordPress Site: Since WordPress is the world’s most utilized content management system, it’s important to know how to install it right through your dashboard. You’ll learn tips and tricks to use your website’s data to its full potential.

4.  The Small Business Guide: A very in-depth resource, this guide is broken down into various sections or chapters that allow you to learn everything from installation to goal tracking and  even e-commerce tracking.

5.   How to Master SEO with Analytics: SEO is essential for your website’s rankings. Positionly will show you how your website can use this data to boost search engine optimization.

Generating a Data way of working:

Being data driven means that all decisions and processes are dictated by the data. If data points to sales being down because of brand perception, then specific actions can be taken to reverse that. If data analysis reveals that users of a current generation of mobile device are leaning toward a specific feature, then the next-generation device can make use of that knowledge.


Common Mistakes Analysts make
1. Not setting up goals or not setting up the right goals
2. Not knowing what they're comparing
3. Taking easy metrics for granted

4. Choosing the wrong graphs

Additional  Web Analytics Tools
Spring Metrics.
Spring Metrics has taken the analytics tool and made it simpler. You don’t have to be a professional data-miner to get the answers to your questions. You get real-time conversion analytics, top converting sources, keyword analytics, landing-page analysis, e-mail performance reports and simple point-and-click configuration.
Unlike Google Analytics, Spring Metrics tracks a visitor’s path through your website from the time he landed to the time he left. All of this is included in Spring Metrics’ Standard Plan for $49 a month. When you first sign up, you get to try it free for 14 days. The simplicity of this tool has a lot of website owners switching over from Google Analytics.

Woopra.
Woopra is another tool that offers real-time analytics tracking, whereas Google Analytics can take hours to update. It is a desktop application that feeds you live visitor stats, including where they live, what pages they are on now, where they’ve been on your site and their Web browser. You also have the ability to chat live with individual site visitors. This can be a great feature for your e-commerce site to interact with customers. Woopra offers a limited freebie plan as well as several paid options.


 Clicky.
Clicky also offers a free service if you have only one website and a Pro account for a monthly fee. You get real-time analytics, including Spy View, which lets you observe what current visitors are doing on your site. Clicky's dashboard is simple to use and presents all the information you want to see clearly. They also have a mobile version that makes it easy for you to check your stats anywhere.


 Kiss metrics.
Kiss metrics is another analytics tool that allows clients to track the movements of individual visitors throughout their websites. You can see how behaviours change over time, identify patterns and see the most typical and recent referrers, among other stats. It offers a “Timeline View” of visitor activity in an easy-to-understand visual format. You can try this service free for 30 days. Plans start at $149 a month, depending on how many events are tracked.

Crazy Egg.
Crazy Egg uses the power of Heat map technology to give you a visual picture of what site visitors are doing on your Web pages. It shows you where people are moving their mouse on the page and where they click. There is a link between where people put the mouse and where they are moving their eyes. So, this kind of tracking helps you see what areas are catching the most attention and interaction from users. There is a free one-month trial with this service, and prices start at $9 month for 10 Heat maps.


Testing
 Introduction:
        Testing is the technique used to know the actual intent of the customers who are visiting a website
        Though a website has a major goal like, content production or e-commence or engagement. There are micro elements that are also part of this. Ex: Looking for careers link in Amazon web site.
        So it’s important to know how each group of users are responding to different group of people.
        We can use testing to know the known- unknown elements
Types of tests
        There are many types of testing techniques that are used. Most popular are,
                a. A/B testing or Split testing
                b. MVT testing or Multivariate testing or bucking testing
        Any testing technique requires having the hypothesis ready and they have a clear definition of test elements.
        By testing, you can’t derive new learning’s other than the elements that we have hypothesis for.
A/B Testing
1. A/B Testing, also known as split testing, is a method of website optimization in which the conversion rates of two versions of a page version A and version B are compared to one another using live traffic.
2. Site visitors are bucketed into one version or the other. By tracking the way visitors interact
With the page they are shown the videos they watch, the buttons they click, or whether or not they sign up for a newsletter you can determine which version of the page is most   effective.

You design two versions of a web page (A & B), divide the traffic between the two, and choose the one that gives you the maximum conversions.

How A/B Testing Works
In an A/B test, you take a webpage or app screen and modify it to create a second version of the same page. This change can be as simple as a single headline or button, or be a complete redesign of the page. Then, half of your traffic is shown the original version of the page (known as the control) and half are shown the modified version of the page (the variation).

As visitors are served either the control or variation, their engagement with each experience is measured and collected in an analytics dashboard and analyzed through a statistical engine. You can then determine whether changing the experience had a positive, negative, or no effect on visitor behaviour.


5 Simple Steps to Start A/B Testing Today

1.    Determine your goal

Your goal will vary based on your business.
For instance, a Business-to-Business company might be focused on generating more leads for their sales staff. On the other hand, an e-commerce Business-to-Consumer website might want to increase sales.

2.Decide what to test

Now that you know your goal and the page you’re going to test, it’s time to decide what element you’ll test.
Here are some options:
·         Your headline.
·         Your offer text.
·         Your button text.
·         Your form fields.
·         The colour of your form button

I could go on and on. There are so many things to test.

Note that some sites will see a dramatic improvement in their conversions just by changing the colour of their opt-in button. Other sites, however, will see little improvement from a button colour change. They’ll have to test bigger elements like their headline, offer, and USP (unique selling proposition).
Why? Well, one reason could be, if your website visitors don’t understand how you’ll help them, they won’t opt-in no matter what color the button is.
Quick Tip: If you’re having trouble deciding what to test, choose something anything. Let’s just get a test up and running. You can always test other elements later.

3. Create your test
There are two parts to this step.
  • The Creative Part
The first is what you might call “the creative” or making another version of the element you’re testing.
For instance, maybe your headline doesn’t immediately tell your visitorWhat’s in it for me?” Write another version of your headline, this time focusing more on your visitor.
  • The Tech Part
The second part of creating your test is the technology you use to deliver each variation to your visitors.
If you’re intimidated by this step, fear not. Modern technology makes this super easy and fast.

4. Wait.
I find this step the most challenging of the five steps, mainly because waiting isn’t my strong suit. However, to get accurate results, we must wait.
Note: Go ahead, log in and check out your results during your test just do not (I repeat, DO NOT) stop, pause, or edit your test until it’s complete.

5. Determine your winner

When your test is over, it’s time to calculate your results or determine if your tests (and the results) are “statistically significant.”
Although it sounds complicated, we’re simply making sure our results will perform the same over the long haul. In other words, how sure are you that your test results are accurate?

A/B Testing Process

Example:
        The current version of a company's home page might have in-text calls to action, while the new version might eliminate most text, but include a new top bar advertising the latest product. After enough visitors have been funneled to both pages, the number of clicks on each page's version of the call to action can be compared.
        It's important to note that even though many design elements are changed in this kind of A/B test, only the impact of the design as a whole on each page's business goal is tracked, not individual elements.
        A/B testing is also useful as an optimization option for pages where only one element is up for debate.
MULTIVARIATE TESTING
Multivariate testing uses the same core mechanism as A/B testing, but compares a higher number of variables, and reveals more information about how these variables interact with one another. As in an A/B test, traffic to a page is split between different versions of the design. The purpose of a multivariate test, then, is to measure the effectiveness each design combination has on the ultimate goal.
Once a site has received enough traffic to run the test, the data from each variation is compared to find not only the most successful design, but also to potentially reveal which elements have the greatest positive or negative impact on a visitor's interaction.


Getting Started With Multivariate Testing 

To create your first multivariate test, first choose a tool or framework that supports multivariate testing. You can use one of the tools listed in the section “Tools” in the end of this article. Please note that not all A/B testing tools support multivariate testing, so make sure your tool of choice allows it.
The following parts of a page (listed in order of importance) are typically included in a multivariate test:
·         Headline and heading,
·         Call-to-action buttons (colour, text, size, placement),
·         Text copy (content, length, size),
·         Image (type, placement, size),
·         Form length.

What to measure: defining test objectives
Before you start formulating a test hypothesis, or begin running tests, the first and most important step is to ensure that there are defined objectives for the website. You'll want to examine your marketing goals in order to determine the appropriate success factors that all of your organization's stakeholders can agree upon. Here are some typical measurable website goals:
Make money: sell product, generate leads, and advertising or promotional click-throughs.
Save money: enable users to adopt self-service features and/or answer product and service questions on their own (such as through online FAQs and documentation).
Examples of Multivariate Testing
 Common examples of multivariate tests include:
1. Testing text and visual elements on a webpage together
2. Testing the text and colour of a CTA button together
3. Testing the number of form fields and CTA text together
Using multivariate testing as a method of website optimization is a powerful method of gathering visitor and user data that gives detailed insights into complex customer behaviour. The data uncovered in multivariate testing removes doubt and uncertainty from website optimization. Continuously testing, implementing winning variations and building off of testing insights can lead to significant conversion gains.